portfolio
Aggregates several already-configured ARTs into a combined Large-Solution or
Portfolio report — as pooled (the solution seen as one system) or
comparison (units side by side). It reuses the build_reports metrics; the
individual ART reports are only referenced, not changed.
Status: available (Alpha)
Manuals
| Language | Download |
|---|---|
| Deutsch (DE) | Benutzerhandbuch |
| English (EN) | User Manual |
| Română (RO) | Manual de Utilizator |
| Português (PT) | Manual do Utilizador |
| Français (FR) | Manuel d'utilisation |
Key concepts
| Term | Meaning |
|---|---|
| ART | Agile Release Train / team group — the level you already report on in build_reports. |
| Solution | A grouping of several ARTs (references their project templates). |
| Portfolio | A grouping of several Solutions (Portfolio > Solutions > ARTs). |
| Pooled | Mode: all issues are merged into one dataset — the solution as a single system. |
| Comparison | Mode: each unit (ART or Solution) is shown separately, side by side. |
Interface
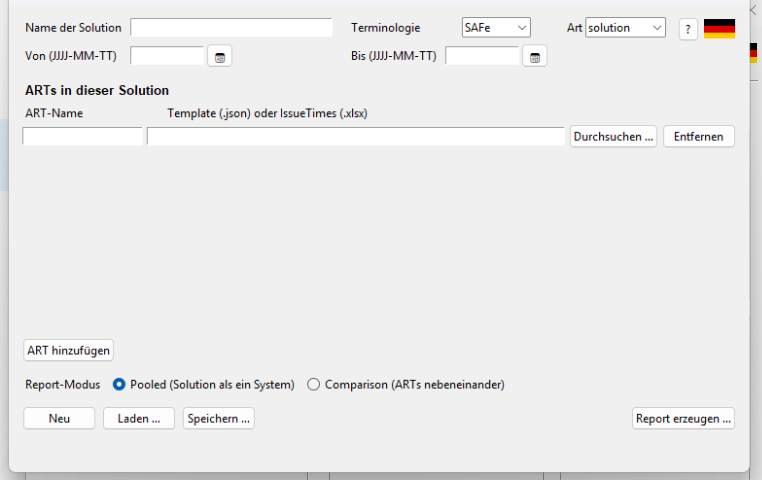
Start
GUI
Or click the Solutions & Portfolios card on the left of the SituationReport launcher.
Command line
python -m portfolio solution.json --mode pooled --output report.html
# comparison mode / PDF output:
python -m portfolio solution.json --mode comparison --pdf report.pdf
The configuration file (solution.json) lists the members (ARTs for a solution,
Solutions for a portfolio) and is created/edited in the GUI.
Report contents
Every report starts with the management summary — one row per unit (pooled: the whole solution/portfolio): items, completed, open (WIP), cycle-time percentiles (median/85th/95th), the target-CT share, and the end-to-end lead time (Created → Closed, median/85th; in pooled mode the solution lead time across all ARTs).
Below it, the Data Quality per Source table shows for every source: record
count, its share of all items, the share without a First Date, the open
share, whether CFD data was supplied, the data freshness — and a traffic-light
confidence (high/medium/low, thresholds documented in summary.py). The
title carries the coverage ratio ("x/y sources delivered data"). In the PDF the
table is page 2.
In comparison mode, Median-CT and 95th-percentile cells are highlighted red when they exceed 1.5× the column median (three rows minimum) — the "which unit is the outlier?" question answers itself.
Capability map & health (optional)
A solution config may reference a capability map via
"capabilities": "path/to/capabilities.json"; the report then renders a
Capability Map & Health table below the quality table (PDF: own page). A
portfolio aggregates the maps of all member solutions and adds a Solution
column. The map:
{
  "capabilities": [
    {
      "id": "C-1",
      "title": "Data insights & reporting",
      "health": "critical",
      "arts": ["ART Beta-3"],
      "owner": "ART Beta-3",
      "assessed_on": "2026-08-26",
      "notes": "optional"
    }
  ]
}
health is one of healthy / at_risk / critical — assessed by people
in PI planning/review (assessed_on records when). arts names the member
ARTs contributing to the capability; a capability with no contributing ARTs is
flagged as uncovered (business value nobody delivers), and an ART name
that is not among the solution's members is logged as a drift warning.
Critical capabilities sort first with coloured health cells; the title counts
critical/at-risk/uncovered. owner names a team, not a person. The capability
map (business capabilities) is deliberately not the stage_map (workflow
stages) — different dimension, different source. Missing or invalid files are
logged and skipped.
ROAM risk board (optional)
A solution config may reference a risk register via "risks": "path/to/risks.json";
the report then renders a ROAM board below the quality table and the
capability map (PDF: its own page). A portfolio aggregates the registers of all member solutions and adds a
Solution column. The register:
{
  "risks": [
    {
      "id": "R-1",
      "title": "Test environment not ordered yet",
      "roam": "owned",
      "owner": "System Team",
      "impact": "high",
      "status_since": "2026-07-15",
      "notes": "optional"
    }
  ]
}
roam is one of resolved / owned / accepted / mitigated, impact one
of high / medium / low. Rows are grouped in R-O-A-M order with coloured
category and impact cells. status_since (when the risk entered its current
category) drives aging: an owned risk older than 30 days gets a red
"Since" cell — ownership without movement is exactly what the board surfaces.
The title counts total, owned, and aging risks. owner names a team, not a
person. A missing or invalid risks file is logged and skipped — governance
data never breaks the flow report.
NFR / architecture-runway dashboard (optional)
A solution config may reference an NFR register via "nfr": "path/to/nfr.json";
the report then renders an NFR & Architecture Runway dashboard below the
ROAM board (PDF: own page, both tables stacked). A portfolio aggregates the
registers of all member solutions and adds a Solution column. The register:
{
  "nfrs": [
    {
      "id": "N-1",
      "title": "API response time",
      "target": "p95 < 200 ms",
      "actual": "p95 = 340 ms",
      "status": "violated",
      "owner": "ART Beta-1"
    }
  ],
  "runway": [
    {
      "id": "RW-1",
      "title": "Automated failover",
      "status": "gap",
      "needed_by": "2026-08-13",
      "owner": "ART Beta-2"
    }
  ]
}
NFR status is one of met / at_risk / violated, runway status one of
in_place / building / gap — assessed by people in PI planning/review;
the tool deliberately does not compute target vs. actual ("the LLM writes, it
does not calculate" applies to the tool as well). Violated NFRs and runway gaps
sort first with coloured status cells; a runway element whose needed_by has
passed while it is not in place renders as overdue (red date cell). The
title counts NFRs (violated/at risk) and runway elements (gaps/overdue).
owner names a team, not a person. Missing or invalid files are logged and
skipped.
Dependency / integration heatmap (optional)
A solution config may reference a dependency register via
"dependencies": "path/to/dependencies.json"; the report then renders a
Dependency & Integration Heatmap below the NFR dashboard (PDF: own page).
A portfolio aggregates the registers of all member solutions and adds a
Solution column to the detail table. The register:
{
  "dependencies": [
    {
      "id": "D-1",
      "title": "Billing API contract",
      "from": "ART Alpha-1",
      "to": "ART Alpha-3",
      "status": "blocked",
      "due": "2026-08-18",
      "notes": "optional"
    }
  ]
}
from needs something that to delivers; status is one of blocked /
at_risk / on_track / done. The heatmap counts open dependencies
(status ≠ done) per from/to pair — each cell carries the colour of its most
urgent status. Below it, the detail table lists every dependency (blocked
first); a dependency whose due has passed while not done renders as
overdue (red date cell). The title counts blocked/at-risk/overdue. to
is deliberately not validated against the member list — integration
points may target another solution's ART, a vendor, or an external system
(cross-solution dependencies become visible in the portfolio report). Missing
or invalid files are logged and skipped.
Decision / assumption log (optional)
A solution config may reference a decision log via
"decisions": "path/to/decisions.json"; the report then renders a
Decision & Assumption Log table below the dependency heatmap (PDF: own
page). A portfolio aggregates the logs of all member solutions and adds a
Solution column. The log — lightweight, ADR-style:
{
  "entries": [
    {
      "id": "ADR-1",
      "kind": "decision",
      "title": "Buy vendor sync service instead of building",
      "status": "accepted",
      "owner": "ART Beta-1",
      "logged_on": "2026-04-05",
      "supersedes": "ADR-0",
      "notes": "optional"
    },
    {
      "id": "AS-1",
      "kind": "assumption",
      "title": "Data quality improves with the next rollout",
      "status": "open",
      "review_by": "2026-08-23"
    }
  ]
}
kind is decision (status proposed / accepted / superseded) or
assumption (status open / confirmed / invalidated) — the parser
enforces the matching status set. supersedes must name an entry in the same
log, keeping the trade-off trail intact. review_by gives an assumption its
expiry: an open assumption whose review date has passed sorts first and
gets a red "review due" cell — the hook for red-team/premortem sessions.
owner names a team, not a person. Missing or invalid files are logged and
skipped.
Custom stage map (optional, config schema 2)
By default, differing ART workflows pool into the three canonical groups To Do / In Progress / Done. A solution config may instead define its own canonical stages:
"stage_map": {
  "stages": {
    "Backlog":     ["Funnel", "Analysis"],
    "In progress": ["Implementing", "Review"],
    "Done":        ["Done", "Released"]
  },
  "first_stage": "In progress",
  "closed_stage": "Done"
}
first_stage/closed_stage mark the CFD boundaries. Source stages the map
does not mention fall into first_stage with a logged warning. Configs without
the block keep the previous behaviour unchanged (v1 files load as before).
Architecture
portfolio/
├── __main__.py        Dispatcher: GUI without arguments, CLI with arguments
├── cli.py             run_solution_report() + argparse CLI
├── solution_config.py Solution/Portfolio config (members, mode, terminology)
├── risks_config.py    ROAM risk register (B3): schema, parse/load/save
├── nfr_config.py      NFR/runway register (B2): schema, parse/load/save
├── capability_config.py Capability map (B1): schema, parse/load/save
├── dependency_config.py Dependency register (B5): schema, parse/load/save
├── decision_config.py Decision/assumption log (B4): schema, parse/load/save
├── aggregator.py      Record-level pooling + rendering (HTML/PDF)
└── summary.py         Management summary + data quality (A1/A2), outliers (A3), ROAM board (B3), NFR dashboard (B2)
Reuses build_reports (loader, metrics, export). Aggregation is done by
record pooling — ART issues are merged at the record level and the existing
metrics run over them unchanged (a pooled median ≠ the mean of medians).