simulate
Throughput-based Monte-Carlo forecast on historical Jira data. Answers two questions probabilistically — without story-point estimation — and derives a scope-confidence view from the same runs.
Status: available (Alpha)
Manuals
| Language | Download |
|---|---|
| Deutsch (DE) | Benutzerhandbuch |
| English (EN) | User Manual |
| Română (RO) | Manual de Utilizator |
| Português (PT) | Manual do Utilizador |
| Français (FR) | Manuel d'utilisation |
What it answers
- How many items will we complete in a given period or by a fixed date? (capacity forecast — set a horizon in days, or a concrete target date)
- When will a backlog of N items be done? (date forecast, optionally with scope growth via a split rate)
- Will we finish the scope by date X? — a confidence gauge derived from the same runs (the point of the exceedance curve at the backlog size).
Results are shown as exceedance percentiles with reference lines at 85 / 75 / 50 %, e.g. "at least X items with 85 % confidence" or "done by day Y at the latest".
Interface
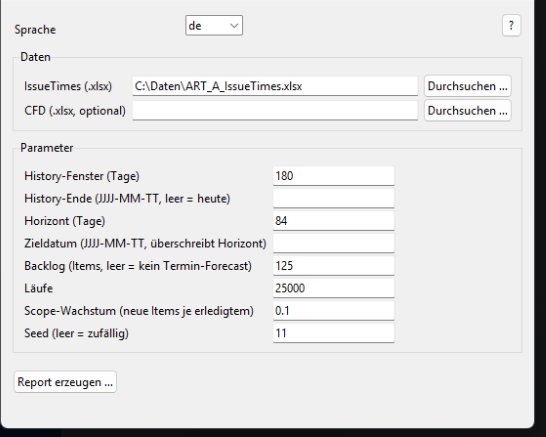
Start
GUI
Or launch the Simulate card from the SituationReport launcher.
Command line
python -m simulate ART_A_IssueTimes.xlsx \
    --horizon 84 --backlog 125 --split-rate 0.1 \
    --runs 25000 --seed 11 --output forecast.html
Parameters
| Parameter | Default | Description |
|---|---|---|
issue_times |
(required) | Path to the IssueTimes.xlsx file |
--cfd FILE |
(none) | Optional CFD.xlsx |
--history-days N |
180 |
History window length in days |
--history-end YYYY-MM-DD |
today | Exclusive end of the history window |
--horizon DAYS |
84 |
Forecast horizon (capacity forecast) |
--target-date YYYY-MM-DD |
(none) | Forecast "how many by this date" instead of --horizon |
--backlog N |
(none) | Also run the date + scope-confidence forecast for N items |
--runs N |
25000 |
Number of Monte-Carlo runs |
--split-rate R |
0.0 |
Expected new items per completed item (scope growth) |
--seed N |
(random) | Seed for reproducible runs |
--output FILE |
(none) | Write the HTML report to this file |
--browser |
off | Open the written report in the browser |
Method
Standard library only (no numpy/pandas) for maximum portability. The empirical
daily-throughput distribution is built from the history window — including
zero-throughput days, so the forecast is not biased upward — and resampled
across runs runs (random.choices, reproducible via a seed). The date forecast
optionally grows the remaining scope by split_rate per completed item; its
percentiles are ranked over all runs, so a confidence above the completion
rate reads "≥ cap" instead of an over-optimistic day. Inspired by the team's R
prototype and by Daniel Vacanti, Actionable Agile Metrics for Predictability.
Architecture
simulate/
├── __main__.py     Dispatcher: GUI without arguments, CLI with arguments
├── cli.py          run_simulation() + argparse CLI
├── forecast.py     Monte-Carlo engine (how_many / when_done / probability_at_least)
├── throughput.py   ReportData -> daily throughput series (incl. zero days)
├── charts.py       Plotly: exceedance curve, target marker, gauge, distribution
└── gui.py          tkinter GUI (de/en)
The engine reuses build_reports.loader.ReportData; the throughput adapter turns
loaded issues into the daily series the engine samples from.