testdata_generator
Generates synthetic Jira issue JSON files in Jira REST API format.
The generated files can be processed directly by transform_data and are
suitable for development, testing, and demonstrations without real Jira data.
Status: available (Beta)
Manuals
| Language | Download |
|---|---|
| Deutsch (DE) | Benutzerhandbuch |
| English (EN) | User Manual |
| Română (RO) | Manual de Utilizator |
| Português (PT) | Manual do Utilizador |
| Français (FR) | Manuel d'utilisation |
Interface
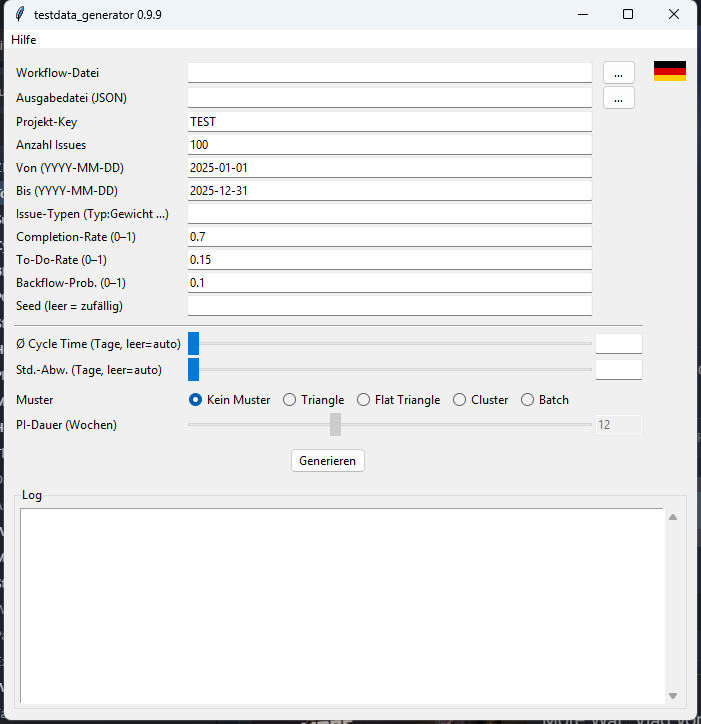
Start
GUI
Or via the start script in the portable package:
- Windows:
TestdataGenerator.bat - macOS:
TestdataGenerator.command - Linux:
TestdataGenerator.sh
Command line
python -m testdata_generator \
    --workflow workflow_ART_A.txt \
    --project ART_A_GEN \
    --issues 200 \
    --seed 42 \
    --output ART_A_generated.json
Parameters
| Parameter | Default | Description |
|---|---|---|
--scenario portfolio |
(none) | Generate the complete demo portfolio instead of a single JSON (see below) |
--workflow FILE |
(required without --scenario) |
Workflow definition file |
--output FILE.json |
<project>_generated.json |
Output file |
--project KEY |
TEST |
Jira project key |
--issues N |
100 |
Number of issues to generate |
--from-date YYYY-MM-DD |
2025-01-01 |
Earliest creation date |
--to-date YYYY-MM-DD |
2025-12-31 |
Latest transition date |
--issue-types TYPE:W … |
Feature:0.6 Bug:0.3 Enabler:0.1 |
Issue types with weights |
--completion-rate FLOAT |
0.7 |
Fraction of closed issues (0–1) |
--todo-rate FLOAT |
0.15 |
Fraction of open issues in To Do stages (0–1) |
--backflow-prob FLOAT |
0.1 |
Probability of backward transitions (0–1) |
--seed INT |
(random) | Seed for reproducible output |
--mean-cycle-days FLOAT |
(none) | Target mean cycle time in days (lognormal) |
--std-cycle-days FLOAT |
(30 % of mean) | Standard deviation of cycle time |
--pattern PATTERN |
none |
Flow anti-pattern: none / triangle / flat_triangle / cluster / batch |
--pi-duration-weeks INT |
12 |
PI cycle length in weeks (for cluster/batch) |
Flow Patterns
Use --mean-cycle-days together with --pattern to simulate typical flow anti-patterns:
| Pattern | Description |
|---|---|
none |
Random cycle time without shape (default) |
triangle |
Cycle time increases linearly over time — triangle shape in the scatter plot |
flat_triangle |
Like triangle, but the increase flattens toward the end (tanh) |
cluster |
Deliveries cluster in the last 2 weeks of each PI (Beta distribution) |
batch |
PI clustering with highly variable cycle time (0.1× to 3× mean) |
# Triangle pattern with mean cycle time of 30 days
python -m testdata_generator \
    --workflow workflow.txt \
    --pattern triangle \
    --mean-cycle-days 30 \
    --std-cycle-days 10 \
    --output triangle.json
Portfolio scenario
GUI: the Demo portfolio section at the bottom of the window generates the complete scenario into a folder of your choice (the seed field is honoured, default 42) — and Open Portfolio Report renders the portfolio report and opens it in the browser. Two clicks from empty folder to a full portfolio evaluation, no command line needed.
Command line:
Creates a complete, consistent demo portfolio in one step: two solutions with
three ARTs each, including every artifact of the processing chain — workflow
files, raw Jira JSON, IssueTimes/CFD/Transitions workbooks, two solution
configs (Solution Beta with its own stage_map, schema 2), a ROAM risk
register per solution (risks_alpha.json/risks_beta.json), an NFR/runway
register per solution (nfr_alpha.json/nfr_beta.json), a capability map
per solution (capabilities_alpha.json/capabilities_beta.json), a
dependency register per solution
(dependencies_alpha.json/dependencies_beta.json), a decision/assumption
log per solution (decisions_alpha.json/decisions_beta.json), a portfolio
config, a PI config, and a README describing the built-in stories. The data window is
placed relative to the generation date so the portfolio report's quality
traffic light rates the sources as current.
Built-in stories (deterministic per seed):
- ART Alpha-3 is the outlier (~3× cycle time) — highlighted red in Solution Alpha's comparison report.
- ART Beta-3 delivers weak data (no CFD, few started issues, data 60 days
old) — confidence
lowin the quality table, coverage below 100 %. - Solution Beta pools via its own
stage_map; Solution Alpha uses the default classification path. - ROAM board: both risk registers together hold nine risks; two owned risks are deliberately old (45/50 days) — the aging highlight fires.
- NFR & runway: six NFRs and four runway elements; Beta's API NFR is violated and one runway element is an overdue gap — the dashboard shows red.
- Capability map: six capabilities; Beta's data-insights capability is critical (weak source) and one Alpha capability has no contributing ART — flagged as uncovered.
- Dependency heatmap: five dependencies; Alpha-1 → Alpha-3 is blocked and overdue (the outlier does not deliver), and Beta-1 → Alpha-1 is a cross-solution integration — visible in the portfolio report.
- Decision log: three decisions and two assumptions; Alpha's stage-map decision supersedes an older one, and Beta's open assumption has passed its review date — flagged red as "review due".
The folder is directly usable: python -m portfolio demo/portfolio.json
builds the portfolio report; the solution configs also work individually.
Workflow file
Same format as in transform_data:
Output and further processing
# Generate
python -m testdata_generator --workflow workflow.txt --project ART_TEST --seed 1

# Process directly with transform_data
python -m transform_data ART_TEST_generated.json workflow.txt
The generated JSON file contains Jira changelog histories with status transitions
along the defined workflow. transform_data processes them into
IssueTimes.xlsx, CFD.xlsx, and Transitions.xlsx.
Direct report (GUI)
After a successful generation the "Create Report" button becomes active in
the GUI. Clicking it runs transform_data and build_reports directly and
opens a combined report (a single HTML page with all metrics) in the browser.
The report covers the entire generated date range — no date filter.
Architecture
testdata_generator/
├── __main__.py          Dispatcher: GUI without arguments, CLI with arguments
├── cli.py               run_generate() + argparse CLI
├── generator.py         Core logic: issue simulation
├── scenario.py          Portfolio scenario (2 solutions × 3 ARTs, all artifacts)
└── workflow_parser.py   Re-export from transform_data.workflow
Tests
Note: Random cycle time distribution
The generator ensures that completed issues close before the configured to-date. The creation date is sampled from a restricted window [from-date, latest_start] where latest_start leaves enough buffer for the maximum cycle time. This produces an evenly distributed, random point cloud in the Flow Time scatter plot rather than a descending diagonal (right-censoring artefact).